Posts Tagged ‘mCommerce’
Cross-Device Shopping Journey Changes [CHART]
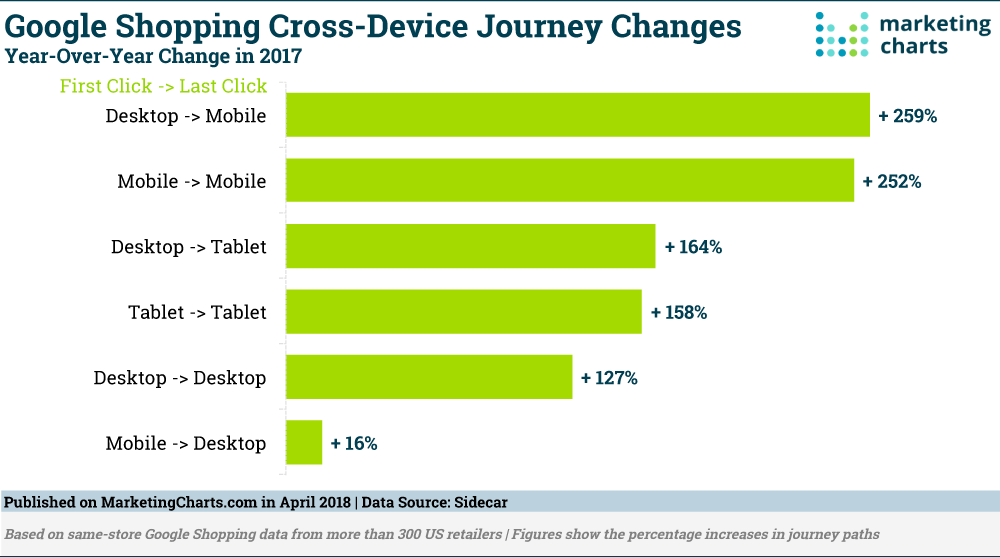
US retailers are prioritizing Google Shopping ads over text ads, according to the 2018 Google Shopping Benchmarks Report from Sidecar. Based on an analysis of more than 300 US retailers’ activity in 2017, the report notes that ad spending across Google’s search network grew by 20%, with much greater increases for Google Shopping ads (34%) than for text ads (2%).
Read MoreUS Proximity Payment Users By Platform [CHART]
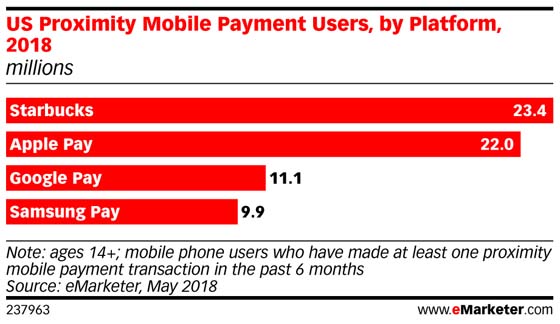
Starbucks will remain the most popular proximity mobile payment app, staying ahead of Apple Pay and other competitors. This year, 23.4 million people ages 14 and over will use the Starbucks app to make a point-of-sale purchase at least once every six months.
Read MoreSmartphone Activities Americans Over 50 [CHART]
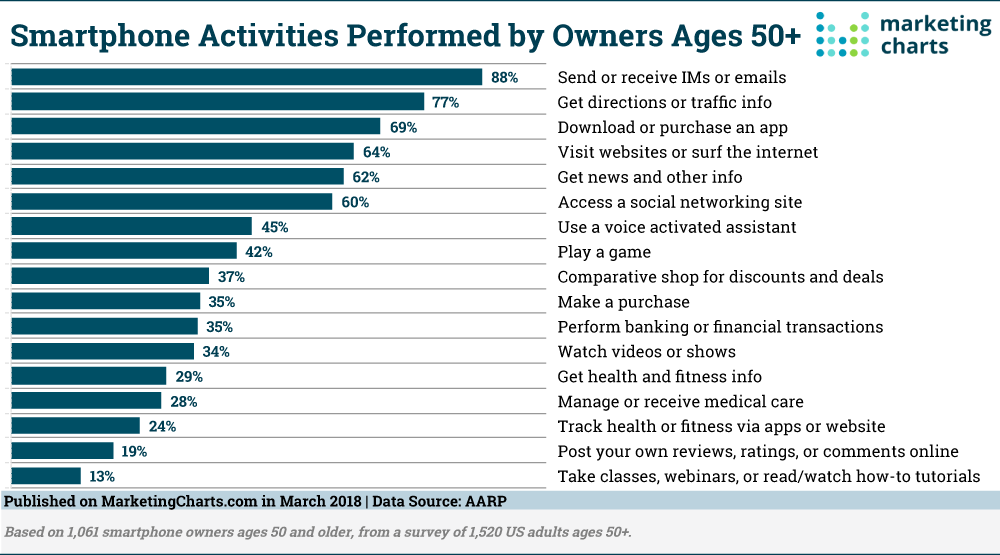
Seven in 10 Americans ages 50 and older own a smartphone, says the AARP in research, and those Americans are most likely to use their devices for messaging.
Read MoreMobile Share Of eCommerce Spending By Category [CHART]
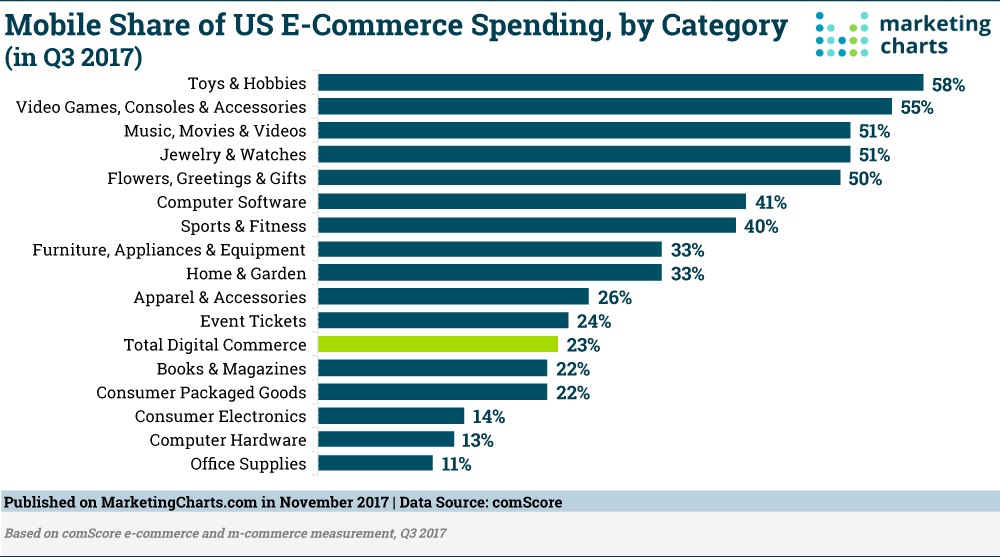
Mobile commerce has grown to represent 23% of all digital commerce dollars in the US in Q3 2017. That’s up from 20% share in the year-earlier period, as mobile commerce growth (+40% year-over-year) continues to far outpace desktop e-commerce spending increases (+17%).
Read MoreMillennials' Likelihood To Participate In Chatbot Commerce [CHART]
Two-thirds of Millennials said they’d be likely to buy an item directly from a chatbot, vs. only 14% who said they would not be interested in doing so.
Read MoreData Generated Per Minute By Platform [INFOGRAPHIC]
This infographic illustrates just how much data media platforms ranging from Twitter and YouTube to Netflix and Spotify generate by the minute.
Read MoreMost Popular Apps For 18-34 Year-Olds [CHART]
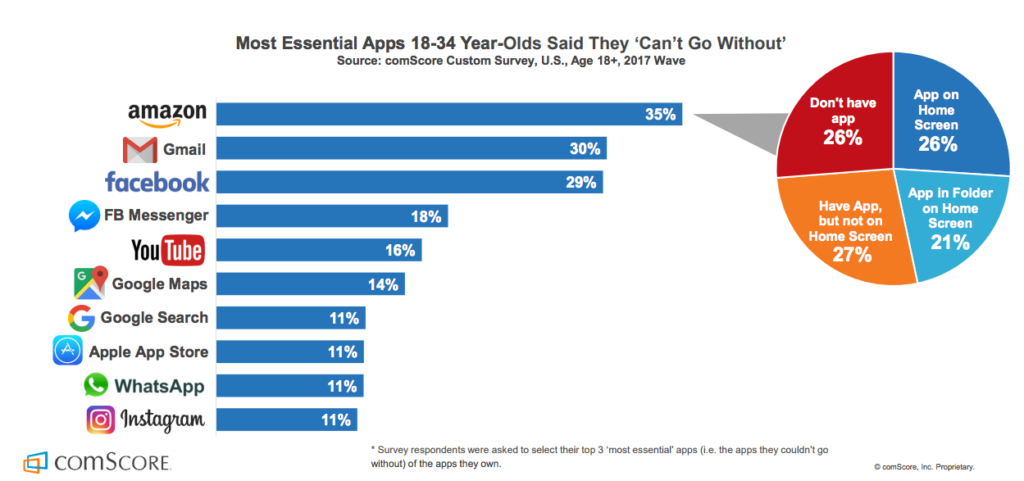
There’s one app millennials can’t live without, and it’s not Instagram, WhatsApp, or Snapchat.
Read MoreMillennials' mCommerce Frequency [CHART]
Many millennial smartphone users in North America and the UK do transact via mobile—whether every day or a few times per week.
Read MoreMobile Notification Benchmarks [CHART]
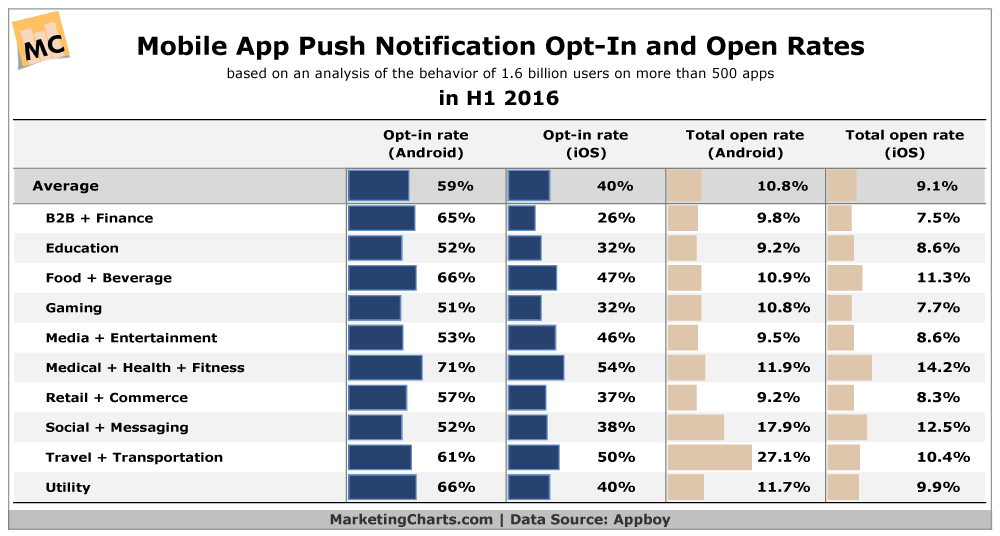
A recent study from Appboy takes a look at various app categories, based on the behavior of 1.6 billion users on more than 500 apps in the first half of 2016.
Read MoreDemographics Of Mobile Payment Users [CHART]
![Demographics Of Mobile Payment Users [CHART]](https://e-strategy.com/wp-content/uploads/2016/10/Demographics-Mobile-Payments-Users.png)
Mobile payment users tend to skew young, with more than 7 in 10 belonging to the Millennial (39%) or Gen X (33%) generations.
Read More