Posts Tagged ‘Restaurant Marketing’
Instagram Stories Case Studies [INFOGRAPHIC]
This infographic from 99Firms illustrates 30 case studies of how companies and brands are using Instagram Stories.
Read MoreMobile Voice Search Behavior [INFOGRAPHIC]
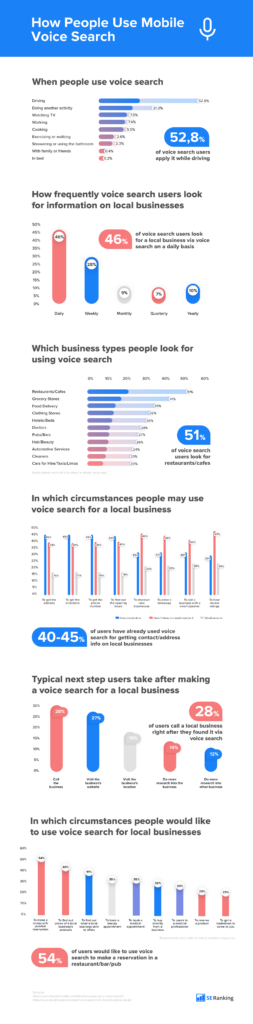
This infographic from SERanking illustrates when, what, where, why and how of mobile search behavior.
Read MoreInstagram Influence [INFOGRAPHIC]

This infographic from X-Cart illustrates the many ways in which Instagram is exerting its influence as a social media channel.
Read MoreImportant vs Well-Executed Restaurant Technologies [TABLE]
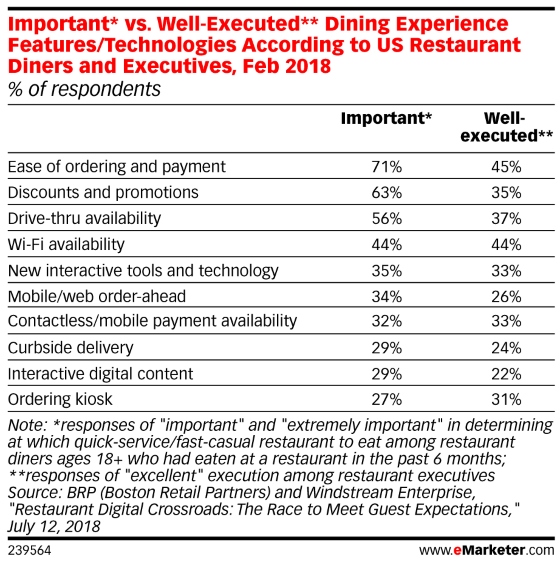
In a February 2018 survey of US internet users and restaurant executives by BRP (Boston Retail Partners) and Windstream Enterprise, restaurant operators met consumer expectations on only two factors: contactless/mobile payment, for which 32% of consumers valued it and one-third of operators offered it, and Wi-Fi availability (44% both valued it and offered it).
Read MoreWhy People Go To The Mall [CHART]
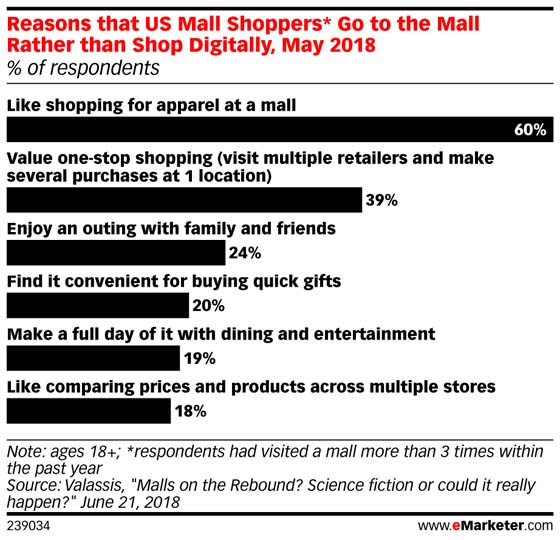
It’s true, merchants can no longer rely on traditional anchors—usually department stores—to attract crowds. According to Coresight Research, the number of full-line department stores will shrink to 4,750 by 2023, down 19.5% from 2017.
Read MoreConsumer Trust By Industry [TABLE]
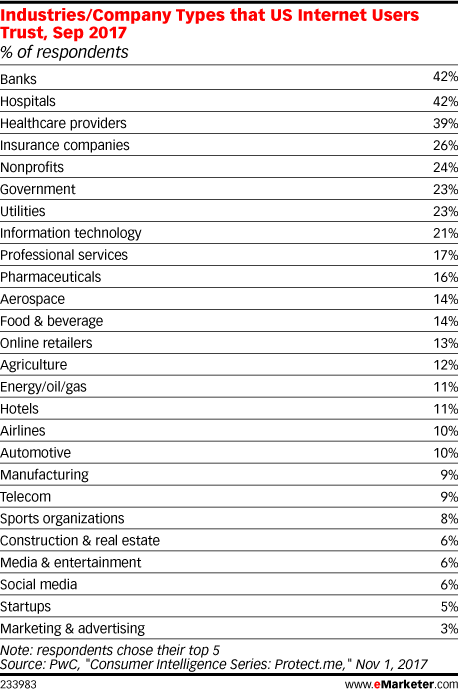
Consumers are more likely to trust banks—and even insurance firms—than marketing or advertising companies. That’s according to a September 2017 PwC survey, which found that just 6% of US internet users said they trusted media and entertainment companies.
Read MoreVoice Assistant Use By Daypart [TABLE]
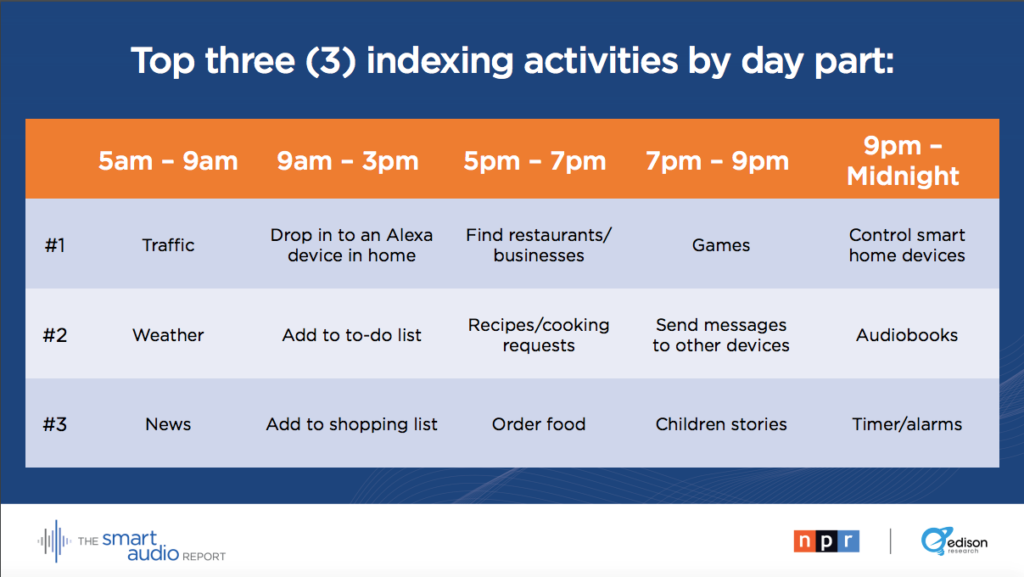
After a surge this past holiday season – when 4% of U.S. adults reported they acquired their first smart speaker device — ownership is up 128% since January 2017, to now one in six Americans (16%) having a smart speaker.
Read MoreIndustry Reputations [CHART]
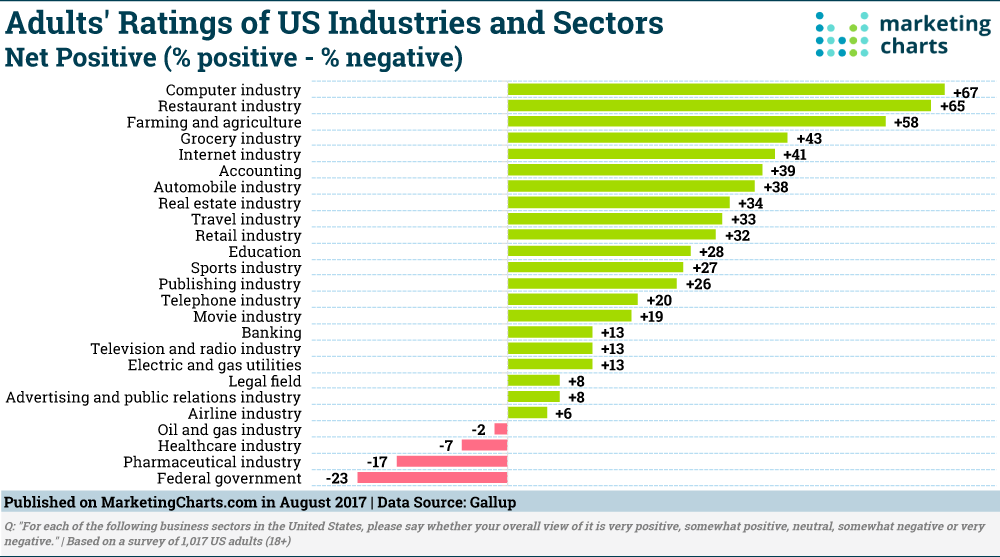
It’s hard to sell to a public that doesn’t view you well… Yet that’s the task faced by the advertising and public relations industry, which continues to rank towards the bottom of all industries in public perception.
Read MoreOnline Reviews & Ratings [INFOGRAPHIC]

This infographic from Websitebuilder.org illustrates the facts and importance of online consumer reviews and ratings to a wide variety of businesses.
Read MoreMobile Notification Benchmarks [CHART]
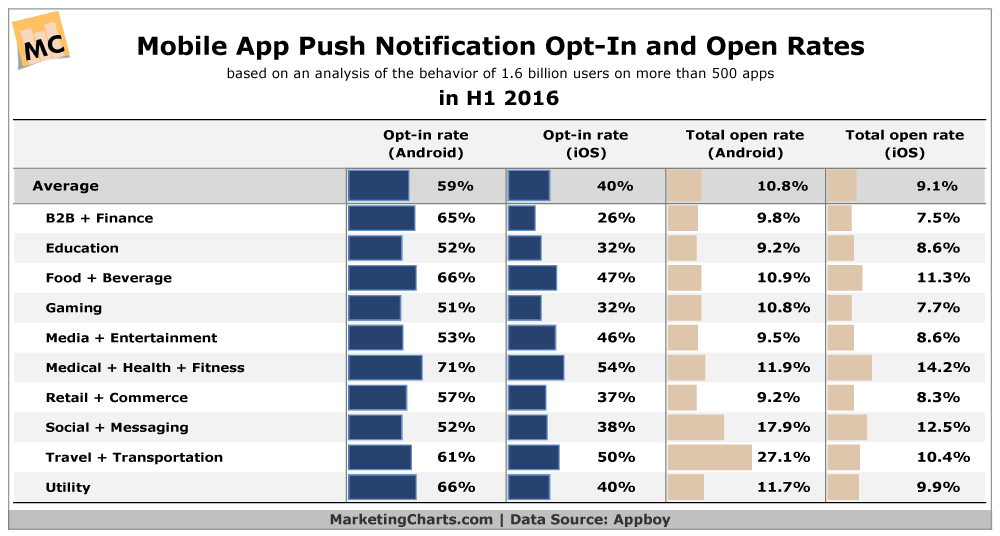
A recent study from Appboy takes a look at various app categories, based on the behavior of 1.6 billion users on more than 500 apps in the first half of 2016.
Read More