Posts Tagged ‘Television Marketing’
How People Discover New TV Shows & Movies
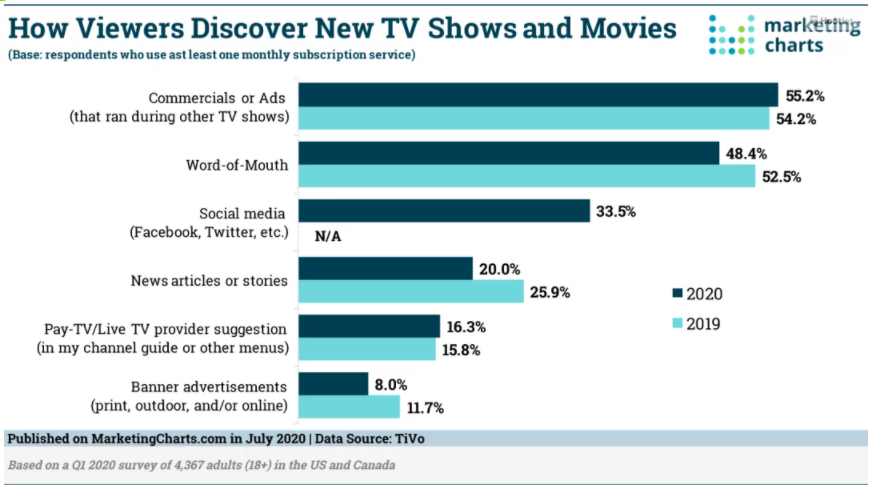
As many people will testify, a common topic of water cooler conversion is what people have been watching on TV – though the decline of linear TV has dampened that trend in recent years.
Read MoreHow Americans Spend Their Evenings
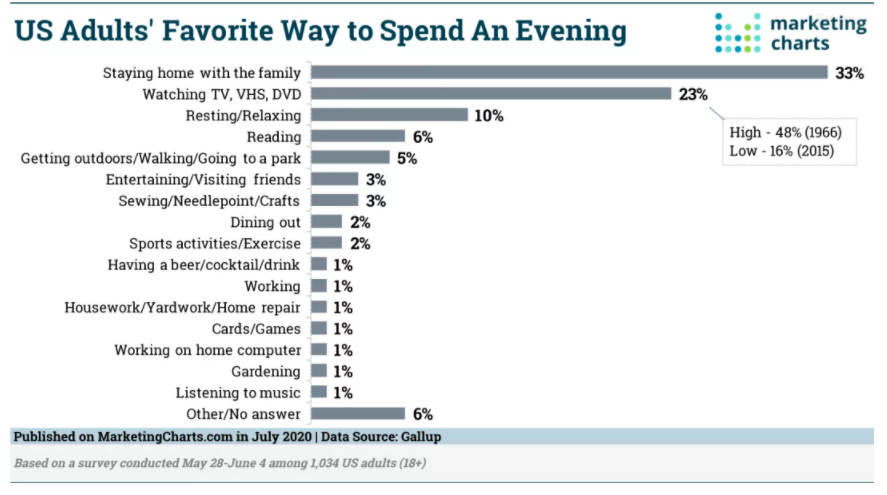
For most Americans, staying home with family is their favorite way to spend an evening, per results from a Gallup survey.
Read MoreDaily Video Consumption, 2013-2021 [CHART]
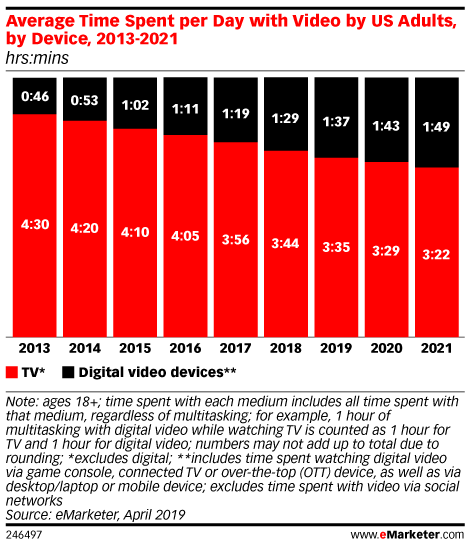
The growing amount of time that people spend on their phones and tablets makes it easier to stream video or play video games in the bathroom. While some advertisers might find this viewing context unsettling, restroom ad specialists have described their viewers as a “captive audience.” Advertisers should think about their campaign goals before they flush away…
Read MoreLate Night Parental Behavior [TABLE]
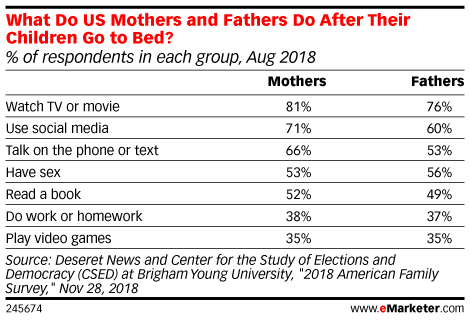
The No.1 post-bedtime activity for both mothers and fathers is watching TV or movies, according to a survey by Brigham Young University and Deseret News.
Read MoreOut Of Home TV Viewing By Generation [CHART]
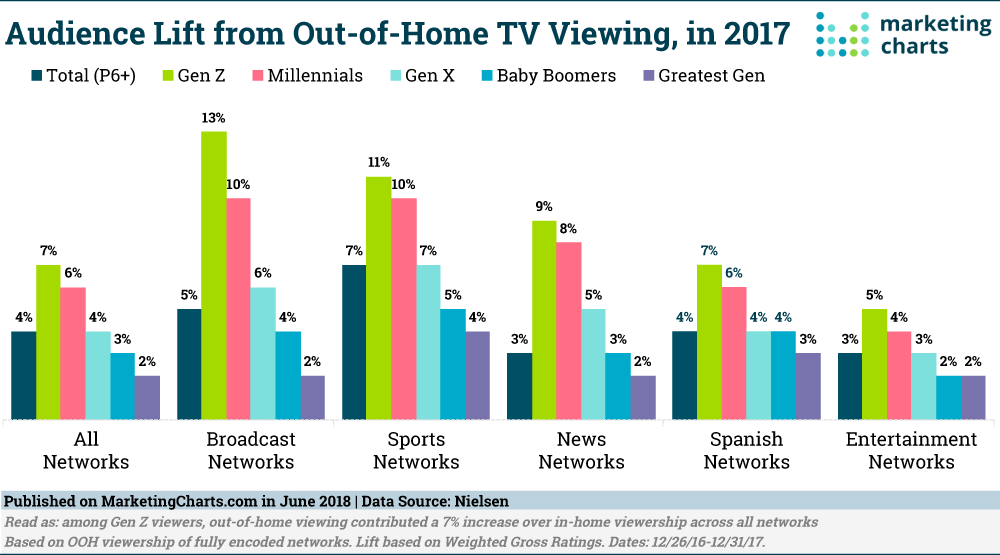
Young people are watching less traditional TV in the home – that much is clear. But data from Nielsen indicates that they haven’t abandoned their interest in linear TV.
Read MoreMillennials' Video Genres
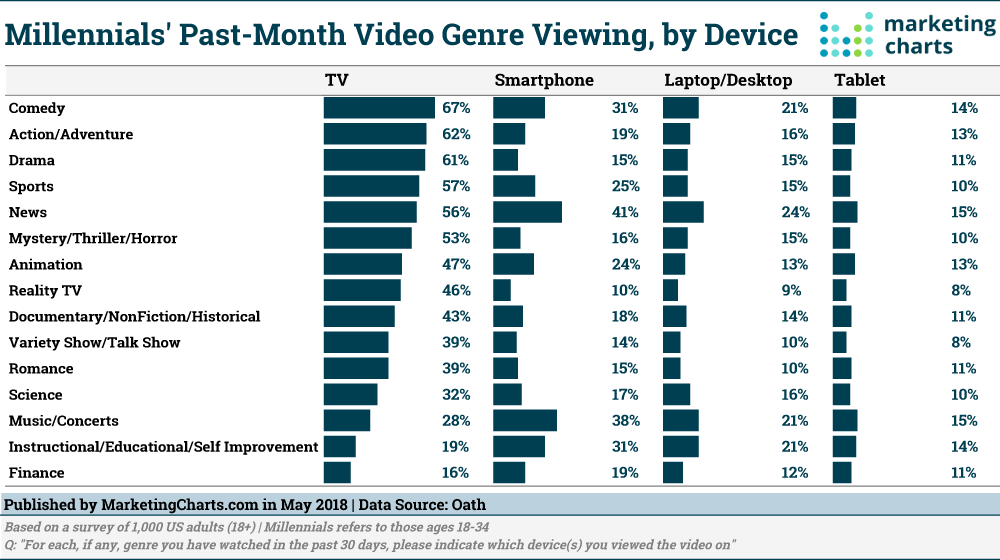
Millennials in the US generally watch Comedy, Action/Adventure and Drama on TV but gravitate to News first on digital devices, finds a report from Oath.
Read MoreMultitainment Users By Device, 2015-2019 [TABLE]
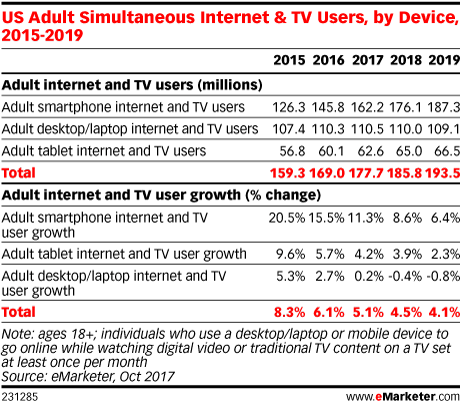
The simultaneous use of second-screen devices—smartphones, tablets and desktops/laptops—while watching TV has increased year to year and will continue through at least 2019.
Read MoreWhy People Stream Video [CHART]
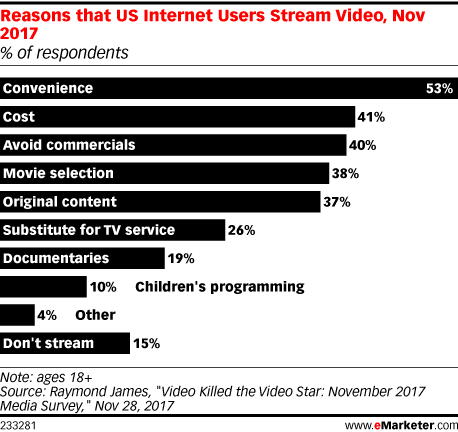
The dramatic rise of Netflix and other over-the-top (OTT) video services has fundamentally changed viewing habits in the US, especially among younger users, but in the short run it can be easy to overrate that change.
Read MoreEntertainment Media Consumption By Channel [CHART]
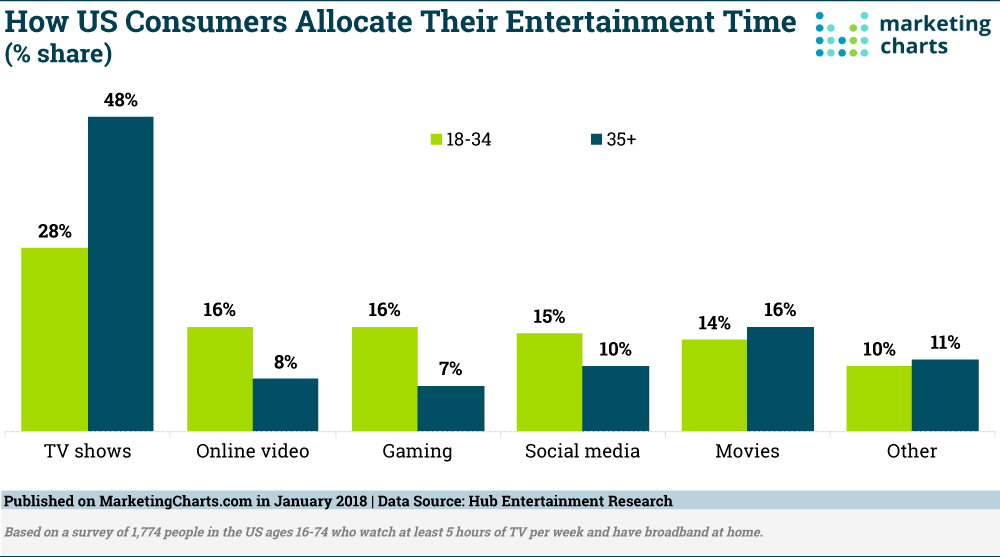
The differences between 18-34-year-olds and those 35 and older were predictable, but nonetheless stark. It’s clear that watching TV shows is a far more popular pastime for adults 35 and up than for their younger counterparts.
Read More360 Videos [INFOGRAPHIC]
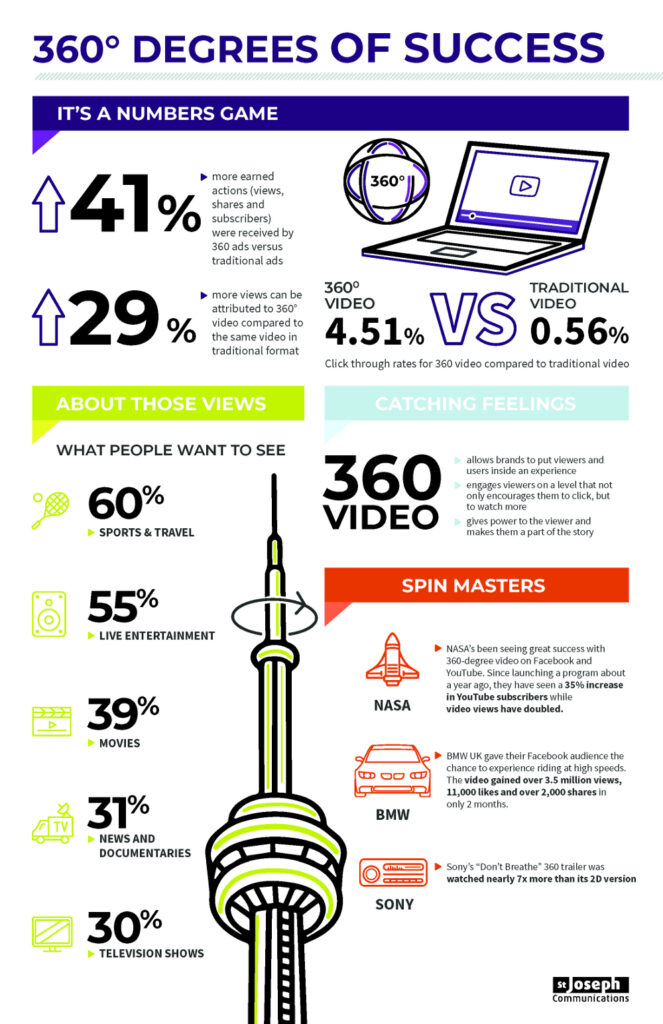
This infographic examines engagement with 360 videos, claiming that they enjoy clickthrough rates averaging 4.51%, compared to 0.56% for traditional videos.
Read More